[R] 시각화
산점도(scatterplot)
1
plot(x,y)
1
2
3
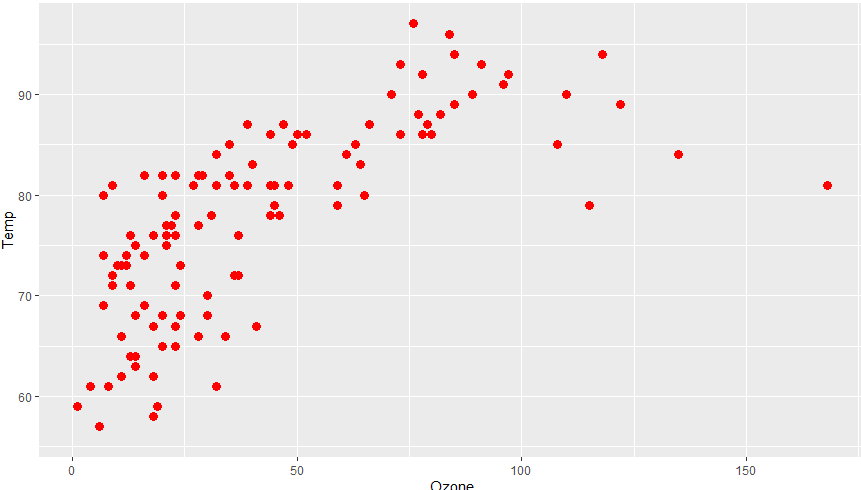
ggplot(data=airquality,
       aes(x=Ozone, y=Temp))+
  geom_point(size=3, col="red")
산점도 행렬(scatterplot matrix)
pairs()
1
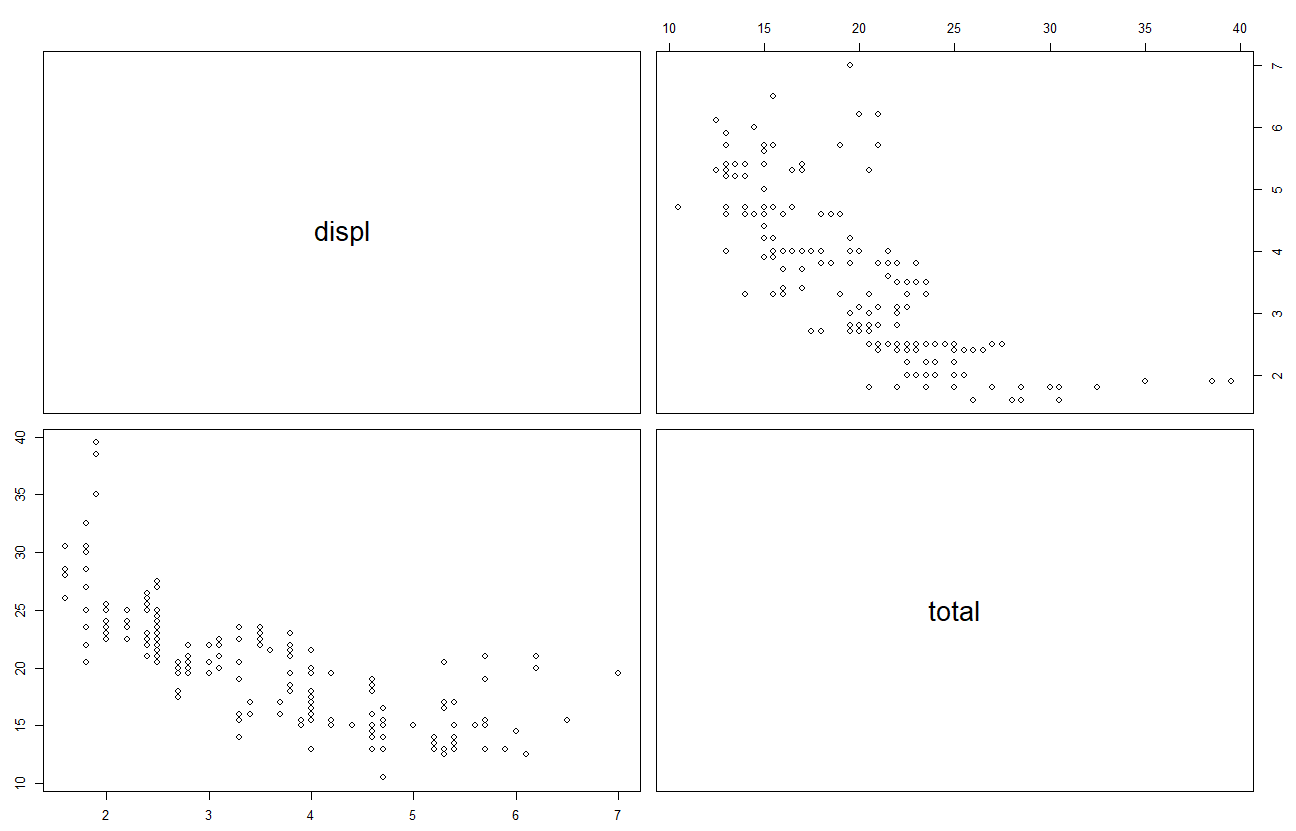
pairs(my_mpg[c(3,12)])
psych::pairs.panels()
1
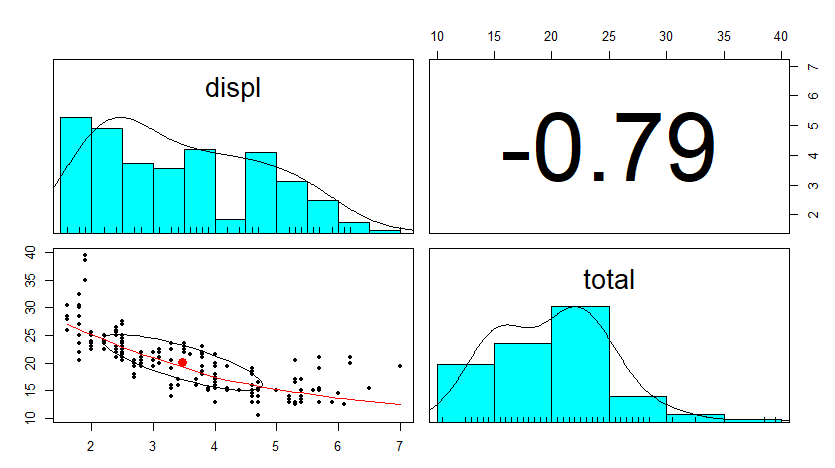
pairs.panels(my_mpg[c(3,12)])
파이 그래프(pie)
1
2
3
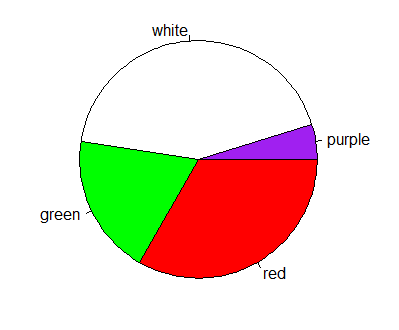
pie.dt <- c(0.05, 0.45, 0.15, 0.35)
names(pie.dt) <- c("purple", "white", "green", "red")
pie(pie.dt, col=names(pie.dt))
막대 그래프(bar)
x값만 필요!
barplot()
1
2
3
4
5
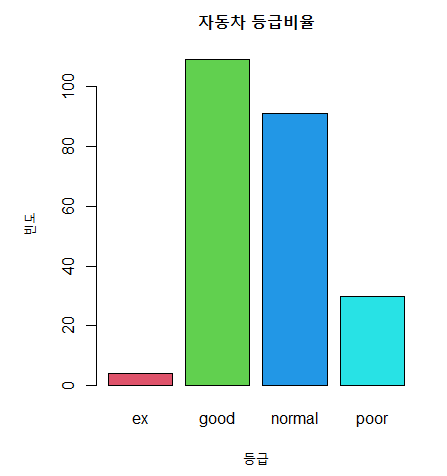
barplot(my_grade, main = "자동차 등급비율",
        xlab = "등급",
        ylab = "빈도",
        col = cc)
cc <- c("lightblue", "navy", "darkred", "lavender")
descr::freq()
1
2
3
install.packages("descr")
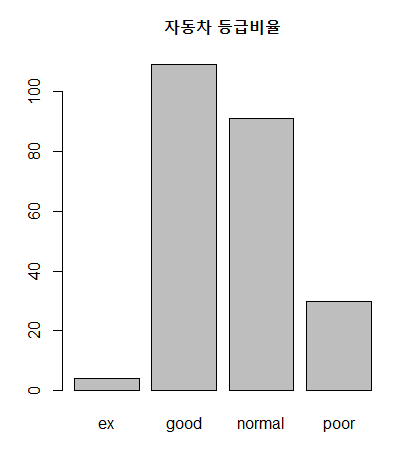
descr::freq(my_mpg$grade,          # plot + 값 출력
            main="자동차 등급비율")
그래프 보기
ggplot()
1
2
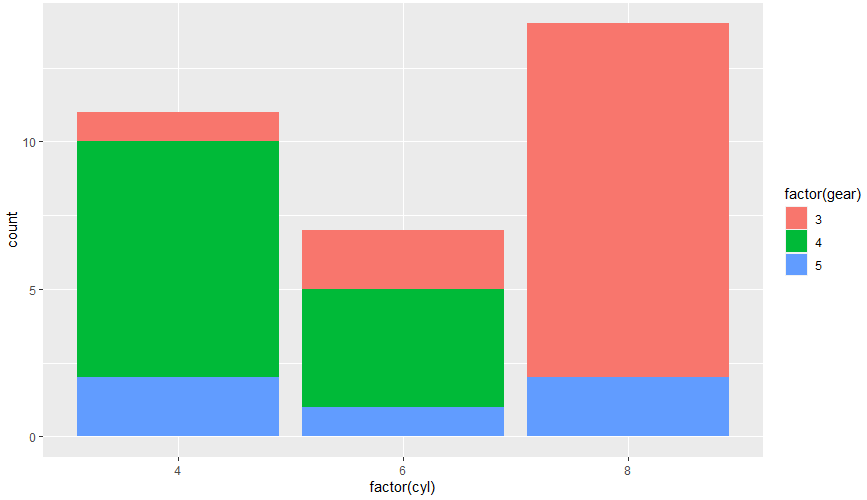
ggplot(data=mtcars, aes(x=factor(cyl)))+
  geom_bar(aes(fill=factor(gear)))
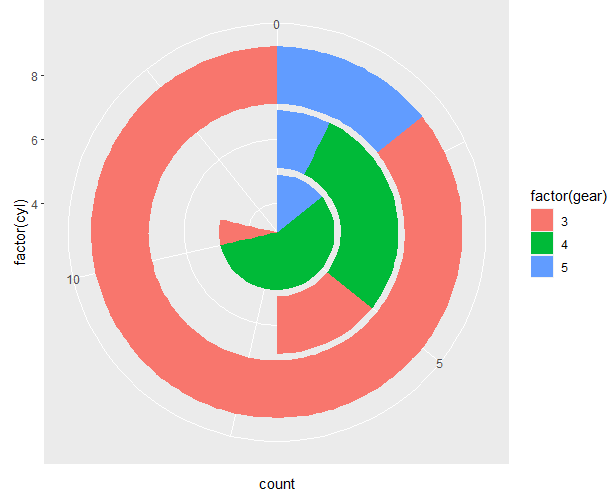
sunburst
1
2
3
4
5
6
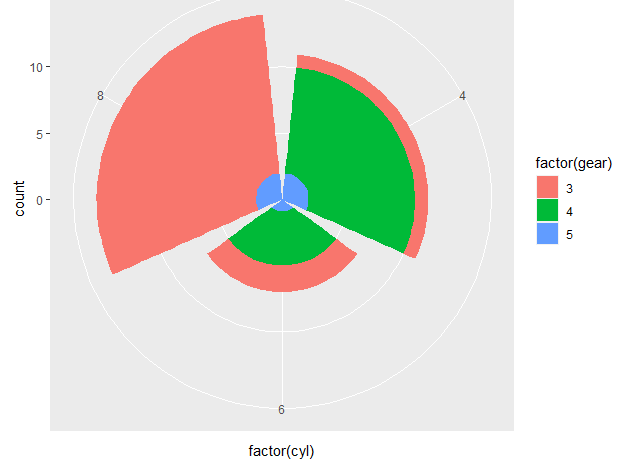
ggplot(data=mtcars, aes(x=factor(cyl)))+
  geom_bar(aes(fill=factor(gear)))+
  coord_polar()
ggplot(data=mtcars, aes(x=factor(cyl)))+
  geom_bar(aes(fill=factor(gear)))+
  coord_polar(theta = "y")
히스토그램(histogram)
plot()
1
plot(airquality$Ozone, col="blue", type="h")
hist()
1
hist(airquality$Ozone)
ggplot()
1
2
ggplot(data=airquality, aes(Ozone))+
  geom_histogram(binwidth = 1.5)
상자수염그림 (Box plot)
boxplot()
1
2
3
4
boxplot(my_mpg$cty, my_mpg$hwy,
        main = "연비비교(cty, hwy)",
        names = c("도심", "고속도로"),
        col = c("red", "yellow"))
ggplot()
1
2
3
ggplot(data = my_mpg, aes(x=drv, y=(cty+hwy)/2),
       group=drv)+
  geom_boxplot()
이 기사는 저작권자의 CC BY 4.0 라이센스를 따릅니다.
