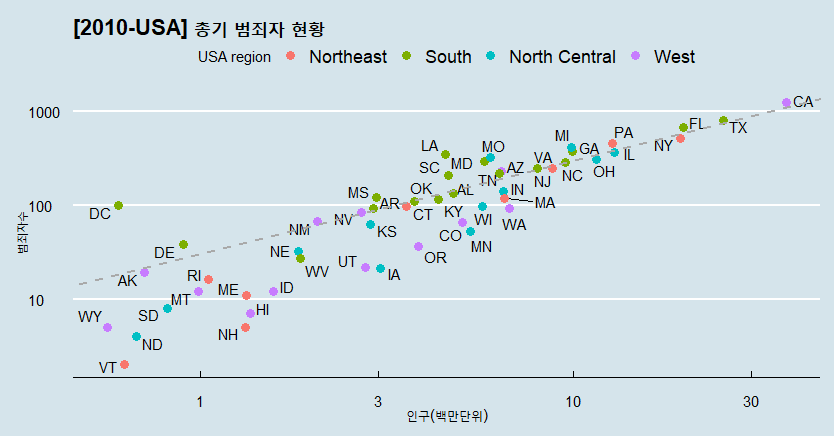
[R] ggplot
1
2
3
4
5
6
7
8
9
10
11
12
13
14
15
16
17
18
19
20
21
22
23
24
25
26
27
28
29
30
31
install.packages("tidyverse")  # ggplot2 + dplyr + tidyr + ...
install.packages("dslabs")     # test dts
install.packages("ggthemes")   # theme
install.packages("ggrepel")    # 그래프에서 텍스트 자동 정렬
library(tidyverse)
library(dslabs)
library(ggthemes)
library(ggrepel)

ggplot(data=murders,
       aes(x=population / 10^6, y=total, label=abb))+
  geom_point(size=2)+
  xlab("인구(백만단위)")+
  ylab("범죄자수")+
  ggtitle("[2010-USA] 총기 범죄자 현황")+
  scale_x_log10()+
  scale_y_log10()+
# geom_text(nudge_x = 0.05)+
  geom_text_repel()+                           # text 자동 정렬
# geom_text(aes(x=10, y=800,                   # 안에 쓴 로컬 요소 우선
#               label="Hello ggplot!!~"),
#           size=10)
  geom_point(size=3, aes(col=region))+         # 기준에 따른 각각 색 변경
# geom_point(size=3, col="red")+               # 전체 색 변경
  geom_abline(intercept = log10(rt2),
              lty=2, size=1, col="darkgrey")+  # lty 1직선, 2점선, ...
  scale_color_discrete(name="USA region")+     # 범례 설정
# theme
  theme_economist()
  theme_fivethirtyeight()
  ds_theme_set()
이 기사는 저작권자의 CC BY 4.0 라이센스를 따릅니다.
